Chart patterns are a key part of daily trading. Candlesticks and other charts generate frequent signals through price action “noise”. The best patterns are those that can form the backbone of a profitable daily trading strategy, be it stock trading, cryptocurrencies in forex trading.
You have to choose from hundreds of trading opportunities every day. This is a result of a wide range of factors affecting the market. Weekly trading patterns allow you to decipher different options and motivations, including hopes and wishes for losses, short-term coverage, stop-loss triggers, hedging, tax consequences, and more.
Candlestick patterns help by drawing a clear picture and displaying trading signals and signs of future price movements. Although it is said that you must use technical analysis to succeed in day trading with candlesticks and other patterns, it is important to note that utilizing it is more of an art form than a rigorous science.
You will learn the power of chart patterns and the theories that govern them. Then, this page will show you how to profit from the most popular day trading patterns, including breakouts and reversals. The ultimate task is to identify the best patterns to complement your trading style and strategy.
Use in day trading
If you use trading patterns correctly, you can add a powerful tool to your arsenal. Because history has a habit of repeating itself, and financial markets are no exception. This iteration allows you to identify opportunities and anticipate potential pitfalls.
RSI, volume, support and resistance levels all help with technical analysis when trading. However, stock chart patterns play an important role in identifying breakouts and trend reversals. Mastering the art of reading these patterns will help you make smart trades and increase your profits, as highlighted in ‘Stock Patterns for Daily Trading’ by Barry Rudd.
Breakouts and reversals
The patterns and charts below feature recurring themes, breakouts, and reversals.
- Breakout – A breakout is simply when price clears a specified threshold level from the chart. These levels are available in many ways, from Fibonacci levels to resistances to trend lines.
- Reversal – A reversal is simply a change in the direction of a price trend. These changes can be positive or negative relative to the general trend. It can also be heard as ‘rally’, ‘correction’ or ‘trend reversal’.
On this page you can see how it plays a role in numerous charts and patterns. You can also find specific reversal and breakout strategies.
Candlestick charts
A candlestick chart is a technical tool you can use. Consolidates data into a single bar within a given time frame. Not only are the patterns relatively simple to interpret, trading with candlestick patterns can help you gain a competitive advantage in the rest of the market.
They first originated where they were used by Japanese rice traders in the 18th century. It has skyrocketed in popularity since Steve Nison introduced it to the West in 1991 with his ‘Japanese Candlestick Charting Technique’.
Here are 3 of the most popular candlestick patterns used in day trading in India, UK and other countries.
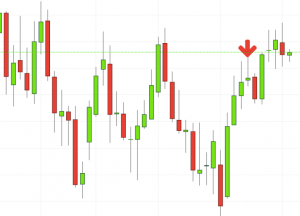
Shooting Star Candlestick
This is often one of the first things you see when opening a pdf with candlestick patterns for trading. This bearish reversal candlestick represents a peak. It’s exactly the opposite of a hammer candle. It will not form until at least 3 subsequent green candles have materialized. This indicates an increase in price and demand. Typically, shoppers lose cool and looming prices as the price rises before they realize they’ve overpaid.
The upper shadow is usually twice the size of the body. This tells us that the last frantic buyers have entered the trade just as those who have taken profits have offloaded their positions. The short seller then forces the price to close the candle, usually near or below the open price. This traps late arrivals who have increased the price. Panic often sets in at this point as late arrivals quickly evacuate their location.
Doji Candlestick
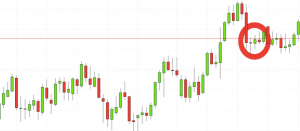
One of the most used candlestick patterns for forex trading is the doji candlestick (doji stands for negativity). This reversal pattern is either bearish or bullish depending on the previous candle. There are close or equal opening and closing prices with a long shadow. It may look like a cross, but it may have a very small body. It is often an indicator of which direction a reversal will go from the previous candle.
If the previous candle is bullish, you can expect the next candle near the bottom of the body to trigger a short/cell signal when the doji trough is broken. Then you can see the trail stop above the peak of Dodge.
Alternatively, if the previous candle is bearish, the doji will form a bullish reversal. A long trigger above the candlestick high is usually formed with a trail stop just below the doji low.
This candlestick pattern can be used on trading days with forex, stocks, cryptocurrencies and many other assets. However, experience is required to use candlestick patterns for interpreting trades, so practice on a demo account before putting real money online.
Hammer Candlestick
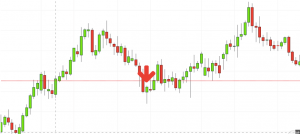
A bullish reversal candlestick. You can use this candlestick to set a capitulation floor. You can then enter a long position, usually with a price crash.
Hammer candlesticks form at the end of a downtrend and indicate a near-term price bottom. The lower shadow is created by the new lower values of the downtrend pattern and closes again near the open. The tail (lower shadow) should be at least twice the actual body size.
Tails stopped when the shorts began to cover their positions and the deal seekers decided to feast. A quantity can also help ruin a candle. To see if it’s a hammer candle, check where the next candle closes. The hammer candle must be closed low.
By being easy to collect and providing detailed information, Japanese candlestick pattern trading has become increasingly popular in recent decades. This makes it ideal for beginner-friendly charts.
More Popular Daily Trading Patterns
Morning Consolidation Pattern
Many successful traders have pointed to this pattern as an important contributor to their success. Attention: There are more than 4 bars moving in one direction. After reaching the highest or lowest price on 1st, the stock consolidates by 1 to 4 bars. Then High or Low exceeds 10:10 AM.
It’s easy to see why this pattern is so popular with active day traders. First, patterns can be easily identified on the chart. Second, the pattern comes to life in a relatively short amount of time, allowing for quick resizing.
The pattern follows strong intervals or multiple bars moving in one direction. That means you’ll have stocks with volatility, an essential component of generating returns throughout the day.
Late Consolidation Pattern
As the day progresses, taking profits is often difficult, so you might be surprised to learn that achieving this trading pattern perfectly is no easy feat. In an overdue retreat pattern, stocks will rise in the direction of a breakout towards the market close.
A word of caution: Traders entering after 13:00 already have a significant break from the long trendline. Check the trend line that started on the same day or the day before. Lastly, keep an eye on at least 4 reinforcement bars before the breakout.
There are several distinct advantages to utilizing this trading pattern. Stocks run all afternoon. So, instead of a frantic morning where you can’t miss a beat, you have time to actually kick back and watch the play play out. Also, the technology will actually work better as the catalyst for the morning shift is reduced.
Stock patterns
In some markets there is fierce competition, such as the stock market. All the more reason if you want to be successful trading by leveraging chart stock patterns. If you see a series of stock price actions over a period of time (in one day), you will be in a better position to predict how they will behave in the future.
For detailed examples of stock trading patterns, please visit our ‘Trading Stocks’ page.
Use Price Action
Many strategies that use simple price action patterns are mistakenly thought to be too basic to make too big a profit. However, price action strategies are often easy to use and effective, making them ideal for beginners and experienced traders alike.
Simply put, price action is how price is likely to react at a particular level of resistance or support. Price action patterns in pdf and charts allow you to identify both fluctuation and trend lines.
Whether you’re trading stocks throughout the day or trading forex using price patterns, you’ll find an easy-to-follow strategy across the board.
Zone Strategy
So how do you start day trading with short-term price patterns? When you download the PDF you will be prompted to use the ‘territory strategy’. One of the definite bonuses of this system is the ability to create simple charts free of complex indicators and distractions.
dead zone
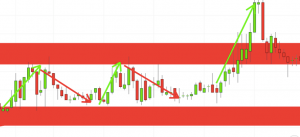
This empty area tells us that price action is not heading anywhere. There is no clear up or down trend and the market is in a state of confrontation. Avoid dead zones entirely if you want big profits. No indicator here will help you make thousands of pips.
Red Zone
This is where things start to get a little interesting. When you reach the red zone, you have the final goal and you will be a 100 pips winner within reach. For example, if the price reaches the red zone and continues to rise, you may want to place a buy trade. It could give you a higher high and could give you an indication that an uptrend will be in the offing.
Most likely when the seller holds. If price hits the red zone and continues its downtrend, a sell trade may be in the cards. You will be making suggestions that there will be new lower lows and downtrends.
End Zone
This is where the magic happens. This strategy allows for a consistent approach from the red zone to the end zone. Draw a rectangle on a chart like the one found in the example. Then only exchange realms. Drawing a red area at 10-20 pips wide gives room for price action to make a general retracement before heading down or up.
Bar outside of resistance or support
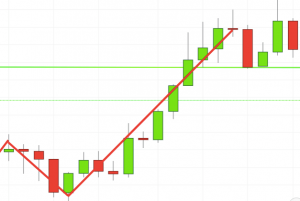
If yesterday or today exceeds the low, it will show an uptrend. However, the stock price is still rising, exceeding yesterday’s peak. If complete opposite price action occurs, you will have perfect bearishness.
Unfortunately, it’s not as simple as identifying an external candlestick and then placing a trade. It’s wise to seek out a day outside after the trend has largely stopped.
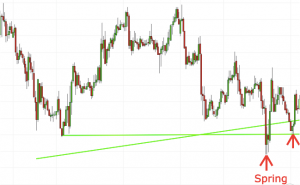
Spring support
Spring quickly returns to trading territory as stocks test their lows, starting a new trend. One of the mistakes traders make is waiting for the last swing to go low. But as you already know, trading setups usually don’t meet your exact requirements so don’t stress out for a few pennies.
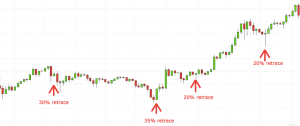
Little-to-no-price-retracement
Simply put, fewer retracements are evidence that the primary trend is strong and will probably continue. Forget coughing at numerous Fibonacci retracement levels. One thing to remember is that the retracement must be less than 38.2%. This means that a breakout in the direction of the main trend is more likely to continue today, even as the asset tests the previous move.
You can try these strategies by directly trading the price patterns. Find the one that fits your personal trading style. Remember that the best trading chart patterns are not overly complex. Instead, it draws a clear picture using minimal indicators to reduce the chances of mistakes and distractions.
Consider time frames
When entering a trade using a short-term price pattern pdf, you should also consider the time period in your calculations. Your market has multiple time frames that exist simultaneously. This means that conflicting trends can be found in trading within a particular asset. While in a medium-term uptrend, a stock can be in a major downtrend.
Many traders make the mistake of focusing on specific timeframes and ignoring key trends that have fundamental influence. Generally, the longer the time frame, the more reliable the signal. Reducing the time frame will distract you from erroneous movements and noises.
Many traders download examples of short-term price patterns but overlook the underlying primary trend, but don’t make this mistake. You should trade the 15-minute chart, but use the 60-minute chart to define the underlying trend and the 5-minute chart to establish the short-term trend.
wrapping up
Our understanding of charting technology has progressed since its beginnings in 1932 by Richard Schabacker in ‘Technical Analysis and Stock Market Profits’. Schabacker argued: ‘Every regular stock chart is a combination of countless different patterns, and accurate analysis depends on continuous research, long experience, and technical and fundamental knowledge of all the finer points… ‘So patterns abound, but from there, it takes constant practice to memorize accurate analyzes and fully utilize them to their advantage.


