The Murrey math trading line strategy is the most attractive forex trading strategy because it is suitable for all timeframes and can be used to trade different markets such as stocks, commodities and forex currencies.

The Murrey Math is a complex set of support and resistance levels that work almost identically to pivot points, providing insight into whether the current trend should continue or reverse. The Murrey Math concept was developed by T. Henning Murrey in 1995 and described in detail in his book “The Murrey Math Trading System for All Trading Markets”.
First of all, we must highlight one of the main principles of Murray’s mathematics. The market behaves similarly. So, the main assumption is that smart money works the same in all markets, which is why different markets have similar characteristics.
Defining Murray Math Lines
Murrey mathematics is based on observations made by WD Gann in the first half of the 20th century. Murrey mathematics was inspired by Gann’s theory to create a system of shapes that could be used to explain market price fluctuations in time. This geometry facilitates the use of the Gann trading technique. Murrey math geometry is so elegant in its simplicity that it makes the Murrey math trading line strategy a complete automated fractal trading system. A key element of Murrey’s trading is that any market’s price movement retraces in multiples of 1/8, 2/8, up to 8/8. Because the price moves by 1/8th. Murrey math divides the price in 1/8 intervals.
murray math lines
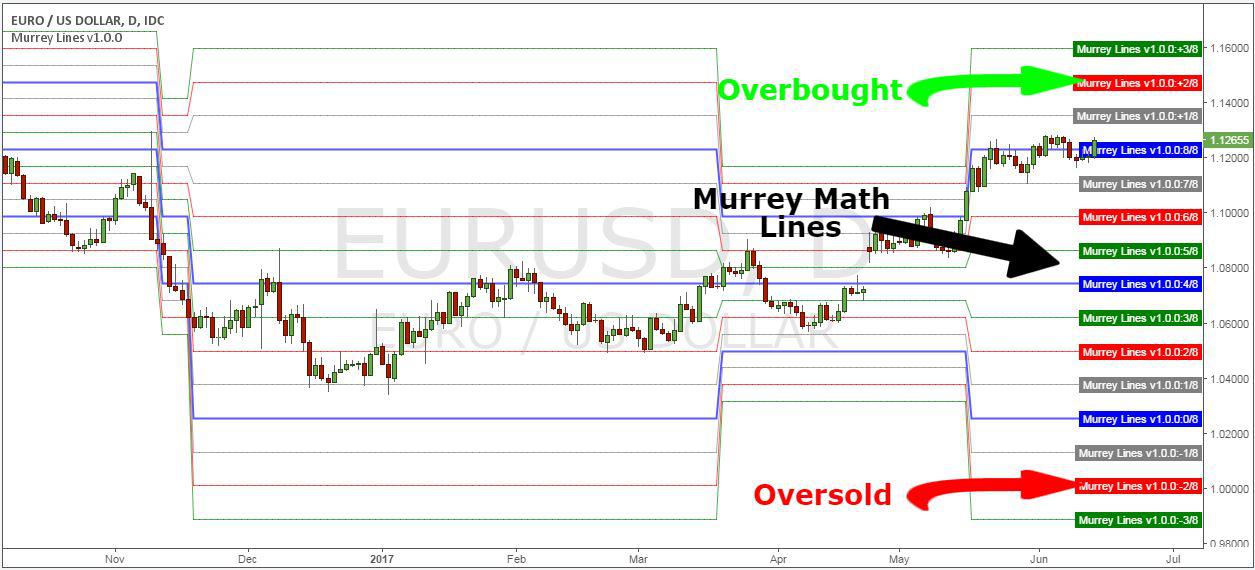
A Murrey Math line consists of 8 “pivot points”, each of which has a different meaning from price action. Basically, the Murrey math trading line strategy is to divide the price into 8 important levels with the 8/8, 4/8 and 0/8 levels being the most important pivots.
now…
Before we move forward, we need to define the Murray Math trading line strategy and the indicators we need to trade on how to use Murray Lines.
: The only indicator you need is
Ditto Line Indicators can be found on the most popular forex trading platforms (MT4 and TradingView) in the indicator library.
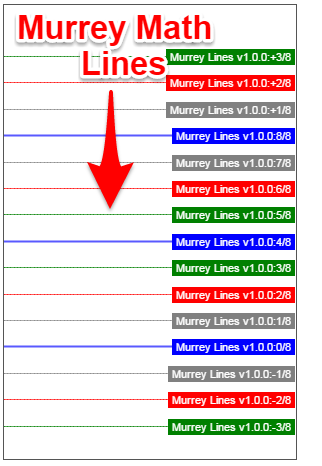
The Murrey line has 9 key components or variables and 6 additional pivots that can indicate overbought or oversold conditions, each telling a different story about price action as follows:
[+3/8] P – Imminent Downtrend
[+2/8] P – Extreme overshoot condition, can be reversed at any time
[+1/8] P – Overshoot condition
[8/8] P – Highest resistance, overbought condition
[7/8] P – Weak level, stop and reverse position
[6/8] P – Strong Pivot Reverse
[5/8] P – Highest trading range
[4/8] P – Key support/resistance pivot points
[3/8] P – The bottom of the trading range
[2/8] P – Strong, Pivot, Reversed
· [1/8] P – Weak and stopped
[0/8] P – Hardest to fall below, oversold condition
• [-1/8] P – Oversold condition
[-2/8] P – Excessively oversold condition, can reverse at any time
[-3/8] P – An imminent bullish reversal Now we have a solid idea of what each Murrey line represents.
got It’s time to explain the Murrey trading rules. Without further ado, this is a step-by-step guide to Murray trading: The Murray Math Trading Line Strategy (Buy Trading Rules)
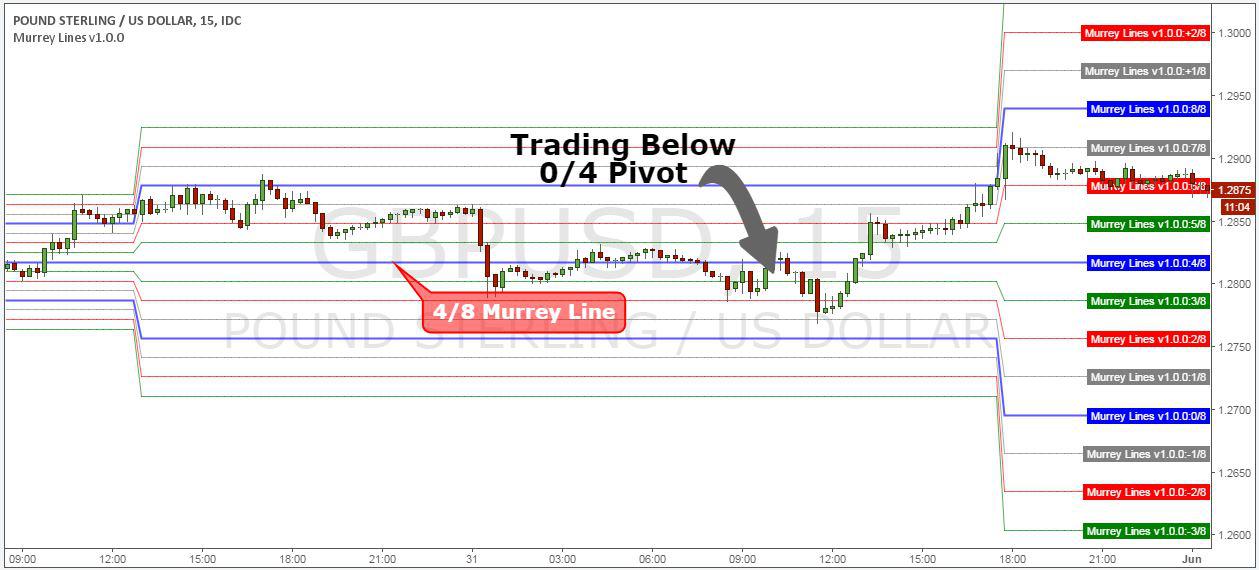
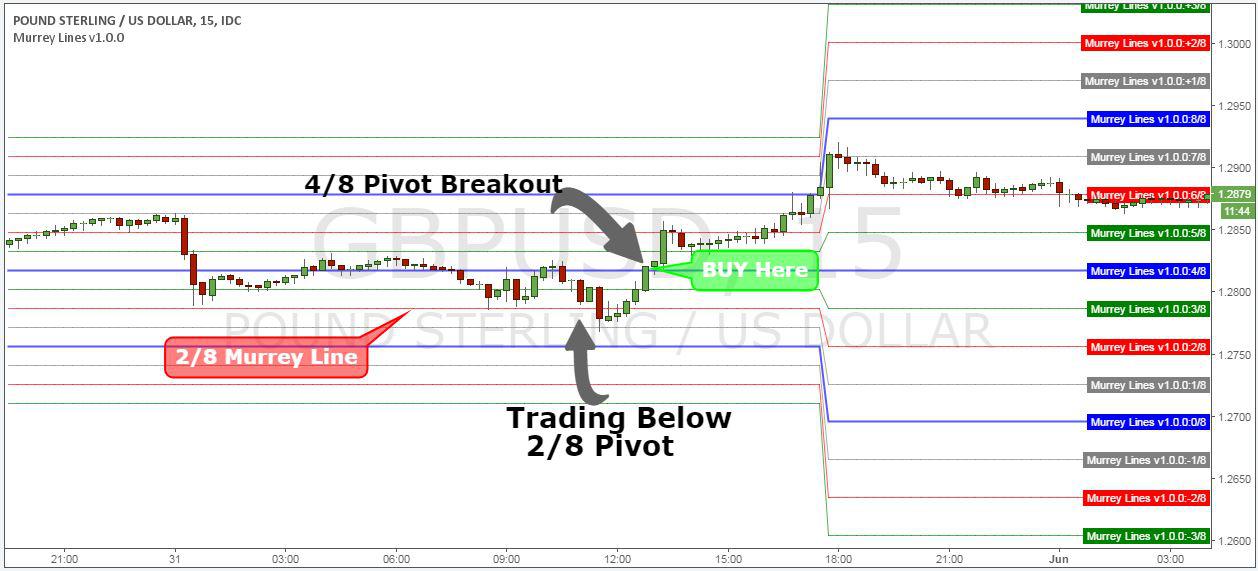
Step 1: Check the 15 minute time frame and make sure you are trading below the 4/8 Murrey line (middle blue line)
The first buy condition of the Murrey trading strategy that needs to be verified is that the price must be trading below 4/8 Murrey Lines. This strategy can be applied to any time frame for the purposes of this Murrey trading strategy, but we will use a 15 minute chart. The Murrey line is a dynamic pivot point that changes with liquid price action, the 4/8 pivot being the most important level which is one of the reasons why price action usually falls between the 0/8 and 8/8 Murrey line. Also read this strategy for daily trade price action. It is not enough to trade below 4/8 Murrey Lines, which presents the following terms of the Murrey Math Trading Lines strategy:
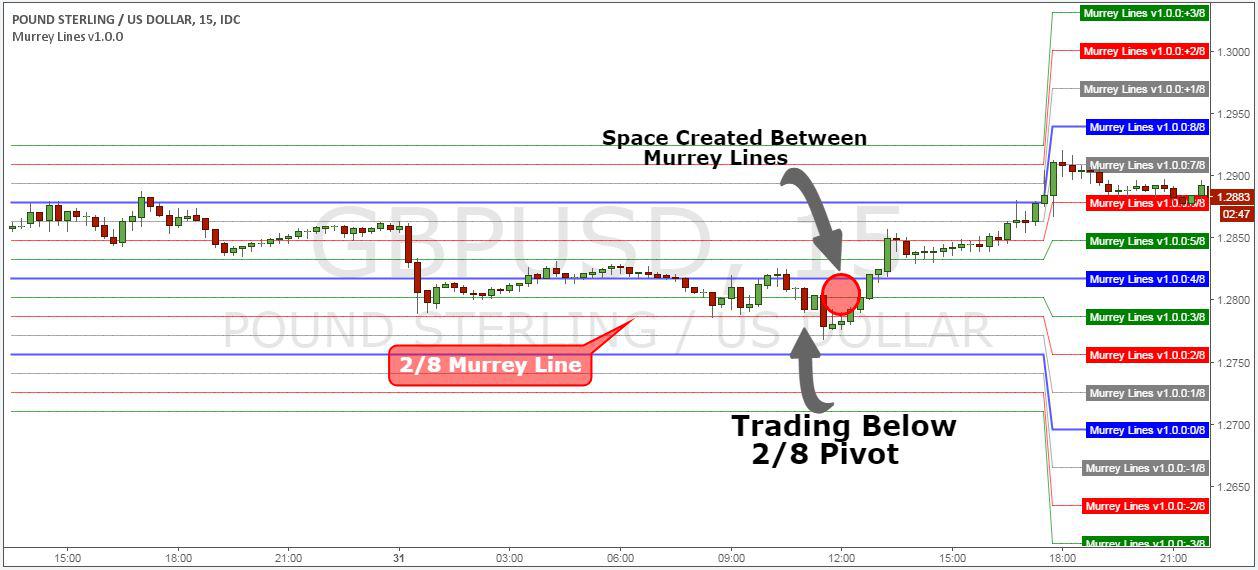
Step 2: If the price is trading below the 4/8 Murrey line, you should trade below the 2/8 Murrey line.
The main reason we need to drop the price below the 2/8 Murrey Lines is because we need the price structure to create space between the Murrey Lines. This will increase your chances of passing the 4/8 Murrey line if you go higher once again.
A picture speaks a thousand words, so take a look at:
Now what we need to set up is where to start our long trades, which leads to the next step in our Murrey Math Trading Lines strategy.
Step 3: Enter a long trade when the 4/8 Murray Line is reversed and broken.
The 4/8 Murrey line is a sand line for buyers and sellers and can turn right when market sentiment breaks. In this regard, we intend to initiate a buy market order as soon as it breaks the 4/8 Murrey line.
Or, to be more conservative, always wait until the breakout candle close price to see if it’s a true breakout. Now is the time to learn the ideal places to hide your stop losses. We pass to the next step.
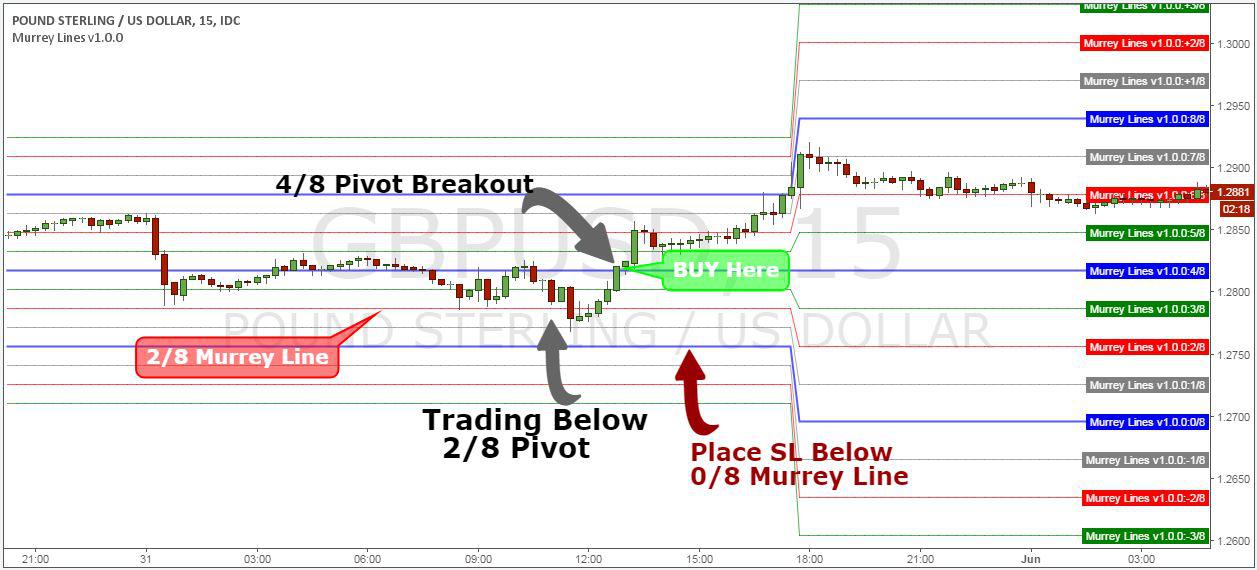
Step 4: Place your protection stop loss below the 0/8 Murrey line
The 0/8 Murrey line is the most difficult pivot for price to move down. This is an ideal place to stash a protection stop loss order. There’s no need to add extra buffers because you don’t want to lose more than you need. Now let’s set up where to earn.
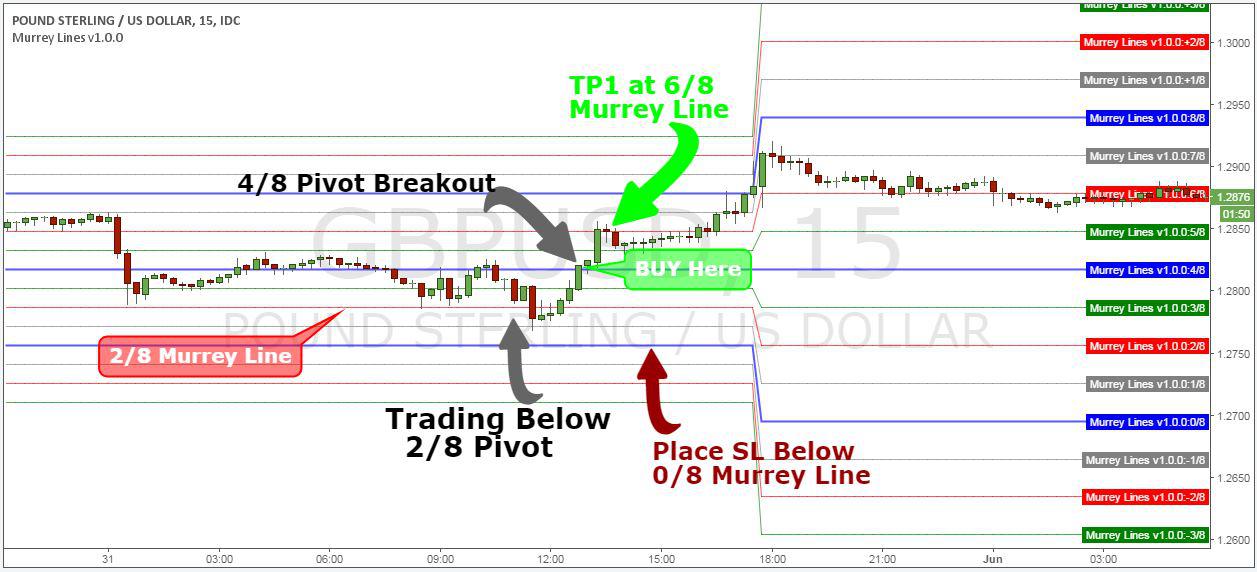
Step 5: Take a partial profit (preferably 50% off the entire order) on the 6/8 Murrey line and move the SL to the BE
The 6/8 Murrey line is the first strong pivot for price to reverse, so you want to take profits right away. At the same time, the next action you need to take is to move the SL from the BE to protect the remaining position. Now let’s see where to close the rest of the trade.
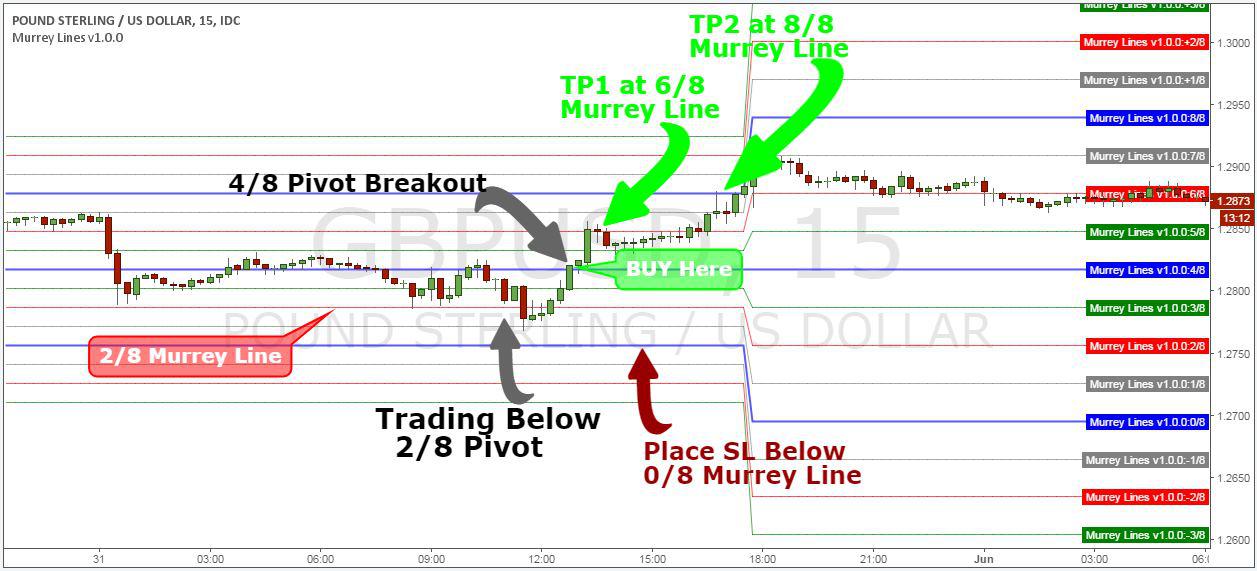
Step 6: Make Final Revenue on 8/8 Murrey Lines
Finally, the trade should be exited when the 8/8 Murrey line is reached. This is the 8/10 Murrey line, indicating an overbought condition in the market. If the market breaks through the 4/8 pivot point multiple times on either side, it’s best to wait until you can clearly apply the Murrey trade setup by applying Steps 1 through 3. Note ** The above is an example of a buy trade using the Murrey Math Trading Lines strategy. Use the same rules for sales transactions. In the picture below you can see an example of a real sale trade using the Murrey Math Trading Lines strategy. Here are the trading conditions you want to avoid in the Forex market. conclusion
The Murrey Math Trading Lines strategy is the best support and resistance system because unlike simple support and resistance levels, Murrey lines are mathematically driven and have a greater impact on how price reacts to each level.
According to Murrey, the same Murrey trading principles outlined throughout this article can apply to any instrument because “all markets behave in a flock-like way” and can be used anywhere, anytime to suit your trading style. Thanks for reading Murray’s Trading Strategies.