Forex trading (‘foreign exchange’ or ‘FX’) is the buying and selling of one currency for another. Transactions are based on exchange rates listed on the counter (OTC) or exchange trading platforms.

The market is the largest in the world, with over $5 trillion in transactions taking place every day. Forex can be traded 24 hours a day, 5 days a week. There is no central exchange for the currency, so it is traded from various sources all over the world.
In each currency pair, the first currency listed is the ‘base’ currency and the second currency is the purchase currency. Therefore, the price quoted with EUR/USD is the number of US Dollars required to buy 1 Euro.
Almost any financial news or global event affects forex prices. With many brokers offering 24-hour market access, low commissions, tight spreads and high leverage, forex trading is very popular with retail investors. However, the risks are high, especially when leverage is involved.
How Forex Pairs Work
Forex pairs are the starting point for Forex trading. A ‘pair’ is the two currencies to be traded. Thus, traders will use other currencies to buy one currency. For example, we use the GBP/USD pair. Traders will use US dollars to buy pounds.
When a price is quoted, it is always the second call to buy the first. For example, for EUR/GBP, the price quoted is the cost in pounds to buy 1 euro. However, decimal shifts make the price look a bit odd to anyone used to exchanging currencies for a vacation. In the EUR/GBP example, the transaction rate is currently 8454.8. For holidaymakers heading to Europe, it equates to 84.5 pence buying one euro.
The currency of your trading account does not matter. Brokers convert currencies as needed to allow traders to buy or sell currencies. Retail forex trading simply speculates on exchange rate movements between forex pairs.
Existing pairs that are traded in high volumes and are referenced in the US dollar are known as ‘major’ pairs. In addition to these traditional forex pairs, there is fast becoming a much broader range of currencies to trade – these are referred to as ‘minor’ or ‘exotic’ pairs. Binary options brokers are now offering options on 40 to 50 different currency pairs from around the world. Emerging markets have added a whole new element to forex trading. These markets include regions such as South America and Asia. A currency often represents market confidence in the entire economy of a given region. Given the wide range of factors contributing to such an economy, it is easy to see why prices fluctuate constantly.
However, minority and exotic pairs can affect volatility due to their low trading volume, but sometimes availability.
How does it affect the forex market?
How will it affect the FX market? almost everything. Almost any global news can affect currency prices. For example, the fall in oil prices was comparable to the fall in the value of the Russian ruble. An economy closely tied to oil will rise or fall depending on the value of that commodity. Of course, there are additional factors to consider, but the example is clear.
A more subtle example is the Indian rupee. Reserve Bank of India’s new governance has increased investor confidence in its recovery plans for India’s currency. That confidence was reflected in Luffy’s strong performance as a result. While India’s currency directly benefited, other Asian currencies also gained, with local performance benefiting the Philippine peso and Thai baht.
Another example is foreign policy. Both currencies could benefit if a country like China needed to broker a gas deal with Russia. If the market thinks one trading partner has the better side of the trade, one currency can suffer the other. Traders can see future foreign policy and invest accordingly. While these examples are some of the more obvious and larger market drivers, they illustrate the fact that forex is a very complex market.
Forex market volatility
Uncertainty in the market usually results in volatility. The global economy is undoubtedly uncertain at the moment. That said, there are many opportunities for forex traders. Binary options provide an opportunity to profit from uncertainty. The range of forex currencies that can be traded through a binary options broker has never been greater and the right strategy for the right currency can be very profitable. Our review highlights brokers that focus on currency binary options.
Forex market opening hours
Some beginners skip some forex basics and get straight to the strategy. It can be a mistake and many lessons are learned. One such ‘basic’ is knowing when a particular market is open.
The Forex market is open 24 hours a day. This is because banks and corporations are open in different time zones around the world. This demand provides liquidity to forex pairs. However, different times of the day tend to differ depending on which part of the globe is open for business. By understanding forex market hours and hourly trends, you can better apply your strategy at the right time.
Forex market session
The main markets are open at different times throughout the day. Which markets are open directly affects liquidity and volatility and forex pairs.
For example, EURUSD is most liquid and volatile during the London and New York sessions, especially during the “overlap” period when both London and New York are trading.
USDJPY typically sees the most volatility when Tokyo first opens and New York a few hours later.
A currency usually becomes more liquid when one or more markets that actively trade or use that currency are open to business.
Here is a GMT based forex session for UK traders.
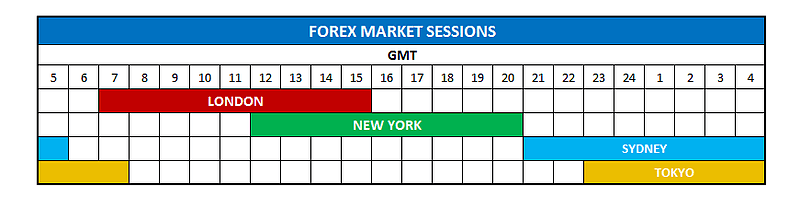
Charts do not show all markets in the world. However, what is shown are the main markets of Forex. The Canadian market is open, New York is open, London overlaps with other European markets.
Germany opens an hour before London. Therefore, some thought it to be an open, London session rather than a start. London doesn’t see a significant increase in volatility on average until it opens.
Daily Volatility
These key sessions directly affect currency pair volatility. Hourly volatility follows a specific trend. If your strategy is based on volatility or if you are using a trend strategy, focus on the timeframes with the greatest price movement.
Use a wide range of trading strategies or trade during calm periods if you prefer low volatility trades. Check out the chart of the decline in volatility over time.
08:00-17:00 GMT offers the best trending opportunities, 13:00-17:00 usually provides the biggest moves.
Those more likely to reduce volatility or range quietly trade between 20:00 and 05:00 GMT.
USDCHF is very similar to EURUSD in terms of its hourly volatility structure, but USDCHF moves less overall each day, so the overall hourly volatility is reduced by a few pips.
NZDUSD has very similar hourly volatility to AUDUSD, moving about the same amount each day.
Business Hours Conclusion
As a trader, learning the basics like what market sessions and hours mean can greatly help you with your strategy and timing. Create a checklist to help you determine the type of market you want to trade, regardless of the trading period. Don’t ‘force’ a deal. It also helps you filter deals and spot good opportunities.
Forex vs binary options
The main advantage of binary options for Trading Forex is the defined loss that can occur on any trade. When you buy binary options you first know, what is your maximum loss? It is defined as the cost of the option itself. You can also define your loss trade Forex by adding a Stop Loss order to your position.
- For example, after 30 pips, where you were trying to stop a loss, the price drops sharply, but stops after 30+ pips due to market volatility.
- The temptation to move a stop loss when the market is getting closer because you feel the momentum is not lasting. In the end, this can lead to far more losses in the trade than you initially risked.
In other words, it can eliminate the need for disciplined risk management. Often traders end up trading emotionally, which can be disastrous in the end. With binary options, the maximum loss is always fixed and there is no more risk of loss.
This is also related to the concept of volatility and with binary options it doesn’t matter how the market moves as long as you make money on the expiration date. To the high volatility of the market – you may see the price work in your favor.
Although the two trading methods share many common characteristics, there are additional elements that set each apart.
- Use . Binary options are usually offered without leverage. Traditional forex often offers a large amount of ‘gearing’. Leverage is a double-edged sword. Some traders will claim the potential extra profit, while others will be concerned about the losses that leveraged trading can result in.
- Danger . The risk and reward starts with binary options. Both best and worst case scenarios are known. In more traditional forex, the profit or loss may not be clear until after the trade. Leverage magnifies this problem.
- Capital Requirements . Traditional forex requires more cash than binary options.
- Flexibility . Binary options can provide touch and range options in a simple way. The same trading profile can be achieved with traditional forex trading, but it requires more thought on behalf of the trader.
- Fixed expiration . A forex trader can start or end a trade without deciding where to end the trade. Binaries must set a specific expiry at the start of the option.
- Monitoring . Binary options can remain mature at expiration without any additional risk. You need to monitor your forex trades in case there are sudden price movements that could trigger a stop loss or something like that. Binaries can of course be traded in their entirety, so some traders may prefer to monitor binary positions.
Trading Speed
Binary options allow very short expiry times. In fact, expiry in minutes is available in just 60 seconds. In forex, the market will move enough in 60 seconds to close your position in a matter of minutes. Assuming payouts on binary options range from 75% to 90%, you could buy an option for £200 and make a profit between £150 and £180 in just a few minutes.
Distance to Target
With Forex trading, you inevitably enter a position targeting a price level that reaches a specific target far from the current price. With binary options, the target price, the strike price, can be in the money, which increases the chance of being in the money at option expiration. Since the forex target price can move away from the current market price, a larger price movement is required to profit at the same level.
In Forex, if the current open price of EUR/USD is 1.1200, you enter the trade with the idea that the market is going up and down. It says 20 pips, but in binary options the strike price would be the current market price of 1.1200. It can go up or down that price by just 1 pip for you even in cash.
Advantages of Forex
The biggest downside to trading binary options is the odds required. In forex trading, if you apply the risk/reward ratio correctly, your personal gains should generally be higher than your losses. This is because you should enter each trade with a target profit higher than your stop loss (e.g. 35 pips for a 25). This means that even if you are right, only 50% should make money. Winning trades can be more profitable than losing trades.
This concept doesn’t work with binary options and it’s easy to see why. With payouts of around 75-90%, traders must win 50% or more of their trades to be more profitable. Each individual trade exposes more funds to the risk than when options options run out of the money. In this scenario, you need to get it right 50% of the time or more to return full profit.
Also, when it comes to binary trading, there is no real secondary market. When you buy an option, you can exit that position before expiration. If you believe the market is changing, you may want to minimize your losses or maximize your profits. So you may find yourself trying to sell the option you bought. To do that, you can only sell it at the price the broker you bought the option shows you.
You can have a variety of accounts with different binary options brokers and compare the prices of the options you want to buy before you actually buy them, but once you’re in a trade and want to unwind, you’ll need to exit the trade before the actual expiry you can at the price your broker displays. Of course in Forex you know that the market is priced freely at any given moment and you get a fair market price to end your trade and not the broker price.
To summarize the binary options vs forex discussion
Which markets are the most profitable to trade? Binary Options or Forex? This is highly dependent on your time in front of a screen each day and your level of commitment in terms of the field of risk management.
With binary options, you don’t have to be in front of a screen for hours a day to continuously track the market on a schedule that may be required when trading forex. You can stand your ground and wait for the resulting break, ensuring maximum liability is the cost of the option. You don’t have to worry about holding your stop loss. The price paid for the option is fixed and cannot be changed.
One thing both markets have in common is the analysis needed to make trading decisions. No matter which market you trade, always look at fundamental and/or technical analysis. Both markets require you to hone your analytical skills and create a profitable trading plan or strategy.
Fundamentals of forex binary options trading
Here, the professional trader and founder of a money management and trade advisory firm shares his thoughts on the basics of forex binary options trading and the system he personally uses.
The strategy below is not a secret, but it is not well known. Simplicity is the reason for success.
EUR / USD
The currency pair I usually trade is the EUR/USD pair. This is because they are the most volatile yet predictable forex pair. It is the most traded pair since the Forex market opened to retail investors. Daily volume has increased significantly since those early days. EUR/USD is also a pair used by financial firms to hedge their profits against market fluctuations.
One issue that comes up regularly in binary options forums is the amount of different strategies being discussed or offered. Most traders believe that the more complex the system, the more profitable it is. When these forex strategies fail, the system is to blame. However, the real problem lies behind the screen. No strategy is tailored to evolving market conditions. Traders have to adapt.
Many people claim that this strategy will not work in certain market conditions. The point is that markets are binary. Prices go up or down. Markets with large scope don’t really exist. All systems have the same ultimate goal. It’s about detecting the best entry and exit points for a given trade.
For example, experienced traders can easily detect support and resistance levels. Beginners may not. The same novice investors can use the strategy using
- Stochastic,
- MACD
- RSI…
… But what they don’t see is that these indicators provide the same entry points used by seasoned traders.
When trading forex binary options, it is important to find the best entry point and know the next price movement.
Note: Below is my personal opinion and the strategies I personally use. You should read everything carefully. Do not use high-risk methods without fully understanding how the strategy works. Before risking real money, consider trading with a demo account. Be prepared to forgo a deal if something causes you to procrastinate. Don’t trade where there are no trades. Opportunity comes.
Forex Fundamentals
The first point is to give an explanation of the forex market in general. Currency exchange is governed by the laws of supply and demand.
Here’s a hypothetical example. US-based Apple (Apple) sells 1 million handsets across Europe, priced at 500 euros per product. The default currency is EUR (€). They use HSBC for liquidation, so these funds will be received there. But – Apple reports in dollars and managed accounts are in BOA.
So Apple put 500 million euros into an account at HSBC in Luxembourg. These funds should now flow into your BOA account and be changed to USD.
Now we need to exchange the currency. Transfer orders will be delivered at 4pm UK time on Tuesdays. It is not immediately transferable. The bank accumulates all USD orders over the night. These may have arrived a month ago.
The UER/USD pair is trading at 1.27000 on Wednesday at 6 AM (GMT). So Apple’s account with BOA gets $665 million at 8:00 AM EST. The order is fixed at 1.27000. How can a bank or retail investor make money on this trade?
How do investors benefit?
BOA will obviously get a fee from Apple, but what about HSBC?
8:00 am (GMT) – Opening of the London market, liquidity is 380 million euros. The price is 1.27010. So 500 million euros is equivalent to 635 050 000 USD. The current market cannot handle this transaction.
Expanding on our hypothetical example, this is what the market looks like. The euro outlook is bullish. Asian markets rose overnight. The US fiscal cliff is being worked out. Millions of retail investors and outlets take BUY orders, 10 pips down from the current price. It currently has 330 million euros of liquidity at 300 million euros. The total liquidity of USD currently on the market is (1.27010) 482 638 000 USD and 381 030 000 USD pending (same as stop).
Currency Exchange
According to the market data, the stop is at 1.26910. So at 8:15 am GMT the order sells the available liquidity (840 million Euro sell order). The effect of this is to push the price towards 1.26905. Your bank’s BUY order will now begin. Other retail investors now place new buy orders to cover their losses.
The price is 1.27099. Here we can gradually exit our BUY positions (assuming we follow a bank transaction). People buy orders as the trend is still going strong. On the chart, it can be seen that the green candles are getting smaller in size after an uptrend.
Trade Results
Thus, market liquidity rose to 380 + 300 = 660 million euros. We took a profit of 9.9 pips (from 1.27000) at 1.27099. Once leverage is factored in and the size of these trades is large, it turns huge amounts of money. Banks (and retail investors) benefit greatly from such moves by utilizing leverage.
These are all pure examples. The truth is that the amount is huge ($4 trillion every day). There are many traders, market makers, and stakeholders in this market, but this example is meant to show how FX works, which is fundamental when analyzing support and resistance (SR) levels and trends.
This level is defined by the larger players. They also hold up really well because retail investors discover and use them. The Smart Money Cycle occurs in three price cycles. Then we see a short-term channel where prices are accumulating slightly.
Forex System – Fibonacci
This price cycle is not random. They follow the order. This sequence is defined by a series of numbers called Fibonacci numbers.
Fibonacci numbers were not developed for trading. They occur in nature where many biological systems can be described by Fibonacci-like sequences.
Major forex traders (including banks) do not use indicators such as RSI, CCI or MACD. They use a system based on Fibonacci numbers.
Combining Fibonacci with accurate price channel calculations and information about other trading methods, you have a profitable trading strategy for forex trading.
Forex using binary?
Why would you consider all of this when trading binary options? Unlike spot forex, you have to be right more often. You need to identify the direction not the size of the move.
During our weekly trading, we do not include the large deals shown above. Since you want to contain price movements (and pips), you should use finding these price cycle moves and reversals. For binary forex (and spot FX day trading) we use 3 indicators with very precise functions.
Forex correlations
Forex correlation is a key tool. If you haven’t learned what they are – they can already hurt your trading. Correlation shows which pairs are moving together. It also pinpoints moving in the opposite direction. Less importantly, it shows which pairs are unrelated.
This helps us determine which trades to take. It can mitigate risk and provide additional trading opportunities that may not be evident on price charts.
How to read exchange correlations
Correlation is usually expressed as a value between -100 and 100. A value of -100 (inverse correlation) shows two forex pairs that are exactly opposite each other. As one rises, the other falls and vice versa. 100 means the two forex pairs are moving together. As one rises, the other also rises. Similarly, if one falls, the other will also fall. Extremes in the spectrum are rare, but the closer the number is to -100 or 100, the stronger the correlation.
Numbers above -/+ 70 are notable correlations. -/+ 80 or higher has a strong correlation. Consider the GBP/USD and EUR/USD crossover above. The figure between GBP/USD and EUR/USD is 89.6. This shows a strong correlation.
Next, judge USD/CHF by EUR/USD. The correlation between these two pairs is -95.4. This highlights a very strong inverse correlation. When EUR/USD rises, USD/CHF falls and vice versa.
If there are many pairs, there is no correlation. If the value (positive or negative) is less than 60, the correlation is not very strong. Values around 0 indicate no correlation at all between the pairs. For example NZD/USD and EUR/USD pairs. The correlation here is -1.7. This means there is no daily discernible correlation between these pairs. In other words, if NZD/USD goes up or down, you have no idea what EUR/USD can do.
Correlation Range
Correlation tables are created and updated based on hourly, daily, and weekly time periods. All of these periods provide useful information depending on the trading period. For short-term trading, hourly and daily correlations are the most important. The numbers change, so don’t take the above as gospel.
Why Forex Correlation Matters
There are many reasons to consider forex correlation. The biggest reason I monitor is to control risk. For example, a trader may assume that diversification is proposed by trading multiple pairs. Just knowing the pairwise correlation can guarantee this.
If you go long (buy calls) in EUR/USD, GBP/USD and sell (buy) USD/CHF, you are essentially taking 3 very similar positions. If one is against you, they will all be against you. The risk has actually tripled. The risk is great if leverage is used.
Another reason why forex correlations are so important is that they can offer you trades you may not have seen. For example, you think EUR will appreciate against USD (i.e. EUR/USD will rise). Looking at the charts, I don’t see any great trade setups. Knowing that GBP/USD usually moves with EUR/USD (per current correlation), you can also check GBP/USD to see if there are better trade setups.
You can also see if there are any trades that will go short (buy) as USD/CHF moves in the opposite direction of EUR/USD. A high correlation (positive to negative) provides an alternative trade. Choose the one with the best trading setup.
Confirm transaction
I also like to use forex correlation to confirm trades. When you find forex pairs that are highly correlated, you use one pair to confirm trades on the other side. For example, if EUR/USD is rising and you want to long your currency, you want GBP/USD to rise as well. Since these pairs are closely related, they should move together. When they don’t, I warn you that maybe I should look more closely at the trade. It doesn’t mean I won’t make a deal. These correlations change and the two pairs do not move in perfect harmony. That means there are always very good reasons to trade.
Correlation can be a complex statistical subject. Hopefully this introduction has given you enough concepts to do a bit of homework. Check the correlation often to know the relationship between forex pairs that can affect your trading.
Use correlation data to control risk, find opportunities, and filter deals. If you’re having trouble seeing how the correlation works, look at the numbers in the correlation table and get a price chart for the two forex pairs you’re having trouble with. Notice how the pair move relative to each other. This will help you to have a general understanding of correlations.
Swing Trading – Definition and Examples
“Swing” trades are trades that are usually open between 1 and 5 days. Traders usually try to follow the momentum of an asset’s price within an established trend channel.
The concept of “swing trading” comes from the stock market and is a type of trading strategy mostly followed by retail traders. The reason is that it is difficult for institutional traders to take positions of the required size without moving the market.
This is not necessarily the case in the Forex market as the interbank market is vast as the major pairs are all liquid. Traditionally, trading positions take their place in the time span between day traders and mid-term investors or traders. Day traders hold positions for seconds or hours at most, while medium-term investors can hold positions for weeks.
However, the forex market is a very different type of ball game. Even in the wildest uptrend or the most savage downtrend, you may find that the day’s price action is going through several highs and lows instead of heading in one direction throughout the day.
A swing trader in the Forex market may be a day trader, looking to take advantage of price momentum both downward and upward. Their goal is to enter the market until momentum rises, but to fall as soon as the market returns to the decline.
What is the analysis of your swing strategy?
Due to the short holding period, swing traders are not interested in fundamentals and focus primarily on technical analysis. It can be as simple as a 3-day moving average crossover strategy, geared towards opening and closing positions early. Or a more sophisticated blend of various technical indicators stacked on top of each other.
In any case, the intention is the same to come in early when momentum shifts and reposition when the market pulls back. Therefore, this strategy is particularly effective when the market is skewed sideways rather than rising or falling. The forex market experiences a lot of volatility, even when the market has clear trends, but trying to sell early in a bullish market can be painful.
Correct market definition
Defining whether the market is currently fit for a given period of time is critical to the successful outcome of this strategy. You need to consider the time horizon you are trading, in the forex market swings occur in relatively short time intervals. So, to determine whether or not the market is trading sideways, you need to stick to the time frame you are trading in. A sideways market is defined when the highs and lows do not cross the previous highs and lows, resulting in so-called channels and other chart patterns.
The shorter the timeframe, the smaller the difference between the high and the low, or the shorter the price action channel. For the weekly chart, you can expect most majors drifting above trend to have wide channels of 2% to 6%. By comparison, if you’re looking at a time chart, the channel is closer to 0.5% to 1.5%. In less than a day, sideways markets can move in very tight ranges as the market consolidates new levels.
Let’s see some examples
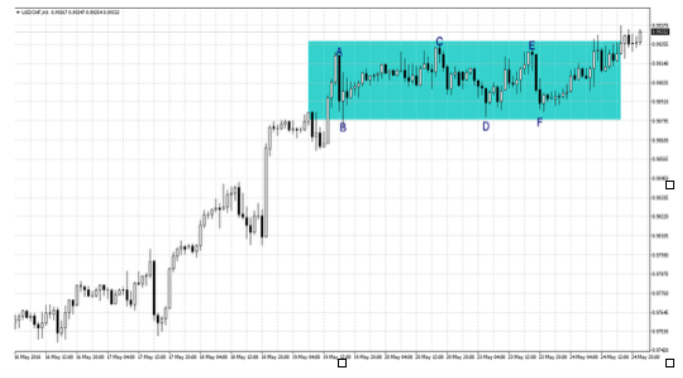
The hourly candlestick chart in the first image is USDCHF. As we can see, the pair crosses a relatively tight price range of around 45 pips between 0.98800 and 0.9925. The blue rectangle from May 19, 06:00 AM GMT to May 24, 03:00 PM GMT shows how the channel’s price action held up over the period. A swing trader’s job is to try to sell short at points A, C and E or buy at points B, D and F.
There is no downtime in swing trading. Strategies are continuously constructed long or short. So there are no closing and waiting periods, which can be useful when the market is retracing. However, if the trend continues to sharpen, it could be excruciating.
Therefore, it is necessary to identify the break in lateral price movement and the development of increased momentum in one direction. In the chart above, it actually looks like the channel pattern is split. Three of the last four bars are closed above the blue square, which should raise a red flag for swing traders. Sideways action may not have developed into a new uptrend. However, you should pay attention to the fact that the price has moved above the channel. We’ll have to wait and see if the market has found new momentum now or simply the top of the channel.
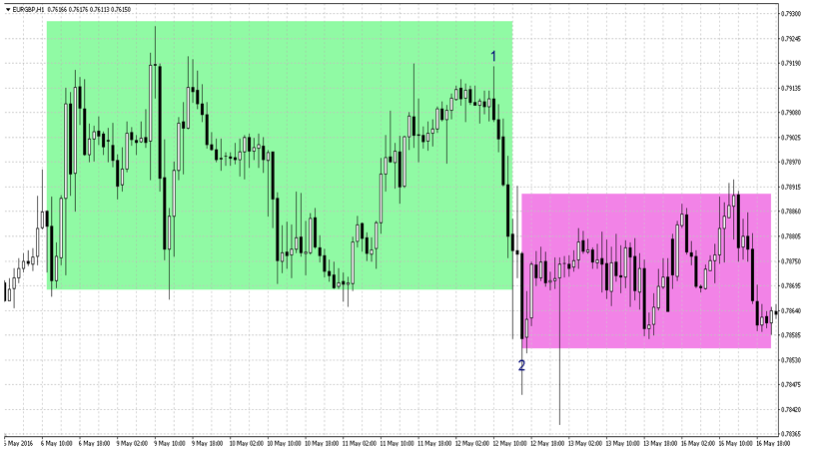
The time chart for EURGBP in the second image shows how price action moves from one lateral channel in the green square to the other lateral channel at the lower level in the pink square. As the price moves from point 1 to point 2, it may be tempting to open a short position at point 2 with the view that a new downtrend is underway. Only to find out that the price is rising again and is trading within the range.
Ultimately, you always have to be vigilant, but even if you are not a swing trader, if you identify the market as a sideways, you will not be caught swinging. Properly identifying market regimes will allow you to buy when the market is down or avoid selling when the market is reversing.