In general, binary options are relatively short-term investments that require research and technical analysis. Because of this, analyzing and interpreting binary options charts is vital to every trader’s success. Because if you don’t know the pros and cons of chart reading and technical analysis you won’t be profitable. These trading charts don’t have to be intimidating and you can become a successful trader if you learn how to use them to support your overall trading strategy.

Period
Binary options are often traded over relatively short periods of time (often days, hours, minutes, or 30 seconds), so it’s important to analyze the charts within a range that fits your trading style. analyze. For example, if you’re trading an asset that expires in an hour, there’s little value in looking at a chart over a 5-year period. Although similar time frames can back up each other to confirm transactions, there are limitations to using unrelated time frames. Charts can be broken down into time periods such as 1 minute, 2 minutes, 5, 10, 15, 30, 45, 60, 90, daily, weekly and monthly.
As mentioned above, it can be advantageous to use multiple timeframe charts when researching possible binary options trades. When doing so, look at longer timeframe charts first. This should provide an overall long-term trend. You can then scrutinize the shorter time frame chart and establish an entry point to engage in a trade. For example, if the daily chart shows a bullish signal and the weekly chart shows a bearish signal, traders may wait for the daily trade to turn bearish. Long-term trends hopefully make you less likely to be prepared for short-term trades.
Binary options chart types
Tables
There are so many chart indicators to choose from that it can make your head spin. ( Price Action See why it’s important ) Technical analysis is a big topic and one that has few definitive answers. Every chart is useful in its own way, so it’s important to understand how and when to use it in your trading strategy. Let’s look at a few to give you an idea of how they can be utilized in binary options trading.
Moving Averages – Many binary options traders make heavy use of moving averages. Some have built their trading strategies around asset prices crossing moving averages over time. The moving average is a trend following indicator based on the historical price of an asset. A moving average can be calculated in two ways. One is that all past prices are weighted equally ( Simple Moving Average ) or more recent prices are given more weight ( Exponential Moving Average ). Bullish and bearish signals are evident when an asset’s price moves above its moving average or when there is historical support for the price relative to the moving average.
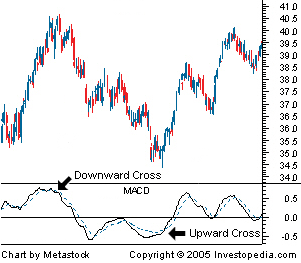 Moving Average Convergence Divergence (MACD) – The MACD is a trend indicator that displays the relationship between an asset’s multiple moving averages (the most commonly used values being the 12-, 26- and 9-day moving averages). Over time, the MACD can show strong bullish or bearish signals depending on when the asset price and the MACD indicator fluctuate, the MACD rises sharply, or there is a crossover between the MACD indicator and the signal line.
- Stochastic Oscillator – Stochastic – An indicator that compares an asset’s closing price to its price range over a period of time. The theory behind stochastic is that in an uptrending market, prices will usually close near their peak, and in a downtrending market, prices will usually close near their bottom. Probability is usually expressed as a number between 0 and 100 or between -100 and 100. Assuming the scale is 0-100, traders start to notice when the value crosses 80 or 20.
- Fibonacci Numbers – Fibonacci mathematicians are mathematicians who have identified a series of repeating numbers in the natural world. Recently, analysts have noticed a similar pattern emerging in the trading markets. They can often be used to set and try support and resistance levels.
- Volatility – Although not a price chart, the current volatility measure of the VIX is a useful graph to keep an eye on. Especially if trading ‘Greek’ is important in your trading strategy. Boundary and ladder options are particularly sensitive to volatility in terms of value judgments.
- RSI (Relative Strength Index) – A momentum oscillator that measures the rate and speed of price movement. Traders can spot oversold or oversold assets and ‘failure swings’. Moves between 0 and 100.
Binary options chart strategies real time
Binary options charts can be very useful in determining entry points for binary options traders and can provide valuable insight into an asset’s past performance, but they must be fully understood in order to be fully utilized. It’s also important not to let your emotions get into the way the charts show them. Please don’t let me tell you that emotions don’t matter if the moving average has a significant trend to the downtrend, such as a downward cross. Indicators tell a story you need to listen to as a trader. Charting can be extremely rewarding if done correctly, but you should first educate yourself and decide what patterns and technical indicators you want to for your trading strategy to use. Each trading strategy is as individual as the person using it. , there are very few ‘right’ or ‘wrong’ answers when it comes to charting. A demo account is a great place to experiment with trading strategies and see what works.
Best Brokers for Charting: