Volume Weighted Average Price (VWAP) and Moving VWAP (MVWAP) are types of weighted averages that include volume in their calculations. It is displayed directly on the price chart.

VWAP is exclusively a daily trading indicator. It doesn’t show up on daily charts or more extensive time compressions (e.g. weekly, monthly).
Price hovering below the VWAP can indicate that a security is “cheap” or “worth it” throughout the day. Conversely, a price higher than the VWAP may indicate that the security is “expensive” throughout the day.
VWAP is also used as a barometer for trading. Trading volume is an important factor related to market liquidity. For example, if a long trade fills above the VWAP line, this may be considered a sub-optimal trade fill.
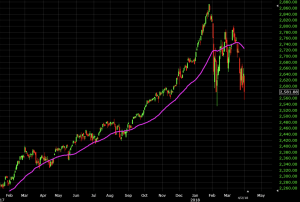
The VWAP movement tracks the VDAP calculation over time, so it essentially forms a moving average. You can adjust the cycle to include as many VWAP values as you like. Below is an image of the moving VWAP applied to the S&P 500 daily chart (pink line).
VWAPs and moving VWAPs may not work with currencies/forex because many software platforms do not account for volume data for this asset class.
Calculate VWAP
VWAP is calculated through the following steps:
1. For each period, calculate a typical price equal to [(H + L + C) / 3], which is the sum of the high, low, and close prices divided by 3. One bar or candlestick equals one period. This period is at the discretion of the trader (e.g. 5 minutes, 30 minutes, etc.).
2. Take the general price (TP) and multiply by the volume (V) to give the value TP * V.
3. Maintain a cumulative table of TP*V totals and a tally of volume totals. These are added and tallied throughout the day.
4. VWAP is calculated by the formula: Cumulative TP * V / Cumulative Volume
When run over all time periods, this calculation produces a volume-weighted average price for each data point. This information is displayed on the price chart and forms a line similar to the first image in this article.
The VWAP move simply adds up the various final VWAP numbers and averages them over a user-specified period.
VWAP is automatically calculated by the charting software. There should be no math or numeric variables that need tweaking. You need to set the desired number of cycles on the moving VWAP indicator.
Uses of VWAP and moving VWAP
As an intraday indicator, the VWAP is usually best for short-term traders who trade for minutes to hours.
As a long-term average, the VWAP move is more suitable for long-term traders who trade over days, weeks or months.
Moving VWAP is a trend-following indicator and works in the same way as moving averages or moving average proxies like moving linear regression. For those who use trend following as the backbone of their trading strategy, the VWAP move can be a viable indicator to incorporate into their own systems.
Price reversal traders can also use a moving VWAP. In such cases, it is better to use a crossover strategy. The basic idea of the crossover strategy is to use the “fast” average to gauge the direction of the trend when it crosses over the “slow” average.
We recommend using shorter timeframes for these averages to find price reversals in a timely manner. For example, “fast” moving VWAP lines can be set to 1-3 cycles, while slow-moving VWAP lines can be set to around 5-10 cycles.
This ensures that changes in price react quickly enough to diagnose trend changes early, before the bulk of the movement has already passed and leaves a suboptimal entry point. How to approach this will be covered in the section below.
Trading examples
As mentioned above, the two primary ways to approach VWAP trading are trend trading or price reversal. Let’s start with trend trading.
Trend by trading examples
As with any other indicator, it is not recommended to be used as the sole basis for trading. You cannot simply follow the slope of a moving average type indicator and expect it to tilt the odds sufficiently in your favor. Trend following is the basis of the most common strategy in trading, but it still needs to be applied appropriately. This can be hinted at from price action, chart patterns, other technical indicators and/or fundamental analysis.
Since this post is focused on technical analysis, we will use VWAP moving in relation to similar thematic indicators. Use the derivative oscillator when the bullish and bearish periods are above or below zero, respectively.
Our trading rules are simple.
Long deal
- A moving VWAP must have a positive slope
- Differential oscillator greater than zero
Short Term Trade
- A moving VWAP must have a negative slope
- Sub-zero differential oscillator
Trade Exit
- One of these two criteria is invalid.
Example # 1
S & Let’s look at an example using VWAP movement on a daily timeframe of P500.
The moving VWAP line is biased towards long-term trading only, as it is skewed positively overall. It fires when the derivative oscillator is above zero and closes when it is below zero. Transactions are indicated by the “Buy” area between the vertical white lines.
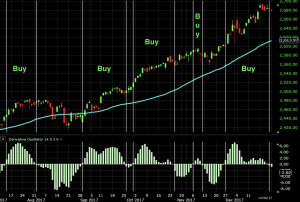
This resulted in 4 decent size winners and 1 small loser.
Example # 2
Here we apply this basic system to an ETF tracking the coffee futures market (ticker symbol NYSEARCA:JO).
We have one long trade and four short trades.
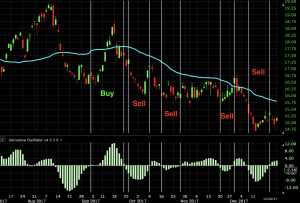
This one has a more mixed performance, with 1 winner, 1 loser and 3 nearly broke.
Price reversal trading examples
Price reversal trades are completed using the moving VWAP cross strategy. Longer time periods wrap older data in the metric. You want to shorten the period because you want to minimize it in order to catch the reversal as quickly as possible.
We want the duration to be short, but not too short, so it ends up being very choppy and gives a number of false or dubious signals. If moving a VWAP, reduce the period of the “fast” line to 1 if necessary. Our “slow” lines can be as short as 5 cycles.
It can be paired with other price reversal indicators such as envelope channels to show when price is increasing. As detailed in this article, this indicator diagnoses when prices may correct. To keep the signal as accurate as possible, we use a longer time period (10) and a standard deviation of 5. With this tight setup, price rarely breaches the upper or lower bands and should theoretically improve the signal. trustworthy.
So, to come up with a rule for this system:
Long deal
- The fast (period 1) line crosses over the slow (period 5) line.
- Last touch on the bottom band
Short Term Trade
- Fast line crosses under slow line
- Recent touches from top bands
Trade Exit
- Subsequent crossover of the moving VWAP line obscures previous trend
Yes
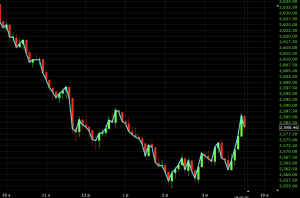
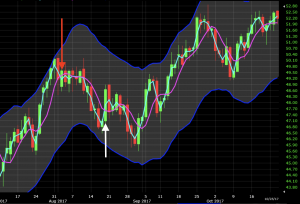
Let’s apply this to the daily chart of the crude oil market.
In the chart below, right before the first trade is ready, we see an explosion of upward momentum in price in the upper band of the envelope channel. When the moving VWAP line crosses, indicating a bearish pattern, a short-term trading setup appears at this point (red arrow). The “fast” moving VWAP line will drop by 2% to 3% before crossing over again to determine the trend. This will result in a trade close (white arrow).
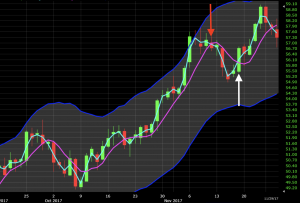
Later we see the same situation. Price moves up through the upper band of the envelope channel. On each of the two subsequent candles, it hits the channel again but rejects the level. When the fast-moving VWAP line crosses below the slow line, it is a signal bringing another short signal to the opposite side of the trend (red arrow). The lines recrossed where the trade ended 5 seconds later (white arrow). If trades were opened and closed on the opening and closing of each candle, these trades would have almost stopped.
Transaction VWAP
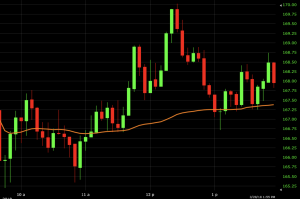
VWAP is calculated only during the day and is primarily used to check the quality of price fills in the market or whether a security is good value on a daily schedule. If the price is below VWAP, it can be considered a good buy. If the price is above VWAP, it can be considered a good price to sell.
Looking at this example of a 5-minute chart from Apple (AAPL), a price lower than VWAP indicates that Apple may be worth a reasonable price.
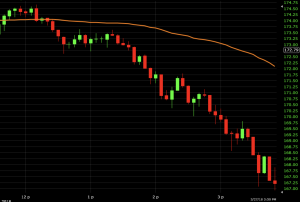
Likewise, if the price moves above the VWAP, it can inform traders that Apple is expensive all day. If you plan to long/buy a stock with a plan to hold it for the short term only, it is best to wait.
Clearly, VWAP is not an intraday indicator that should be traded on its own. However, it is one of the tools that can be included in a set of indicators to better inform your trading decisions.
conclusion
VWAP is calculated throughout the trading day and can be useful in determining whether an asset is cheap or expensive during the day. Traders can determine the quality of their execution by checking the VWAP if they have taken a stance on a particular security. If the fill price is below the VWAP, it is considered positive (if the trade is a long/buy position). A price above VWAP is considered negative.
VWAP starts fresh every trading day.
The VWAP movement is the next trend indicator. Multi-day VWAPs can be combined and customized to suit the specific trader’s needs. Long-term moving VWAPs are commonly used by long-term traders to track multi-month or multi-year trends. It can dampen the “noise” in the market for traders who are more interested in long-term trends or cycles that may exist in a particular market rather than focusing on day-to-day movements.
Price reversal traders can use a crossover moving VWAP to pinpoint a turning point in the market. Moving VWAPs are therefore versatile and very similar to the concept of moving averages.